When your Campaign is live, statistics are collected daily to track how many times your ads are shown (Impressions), clicked, viewed, and more. These daily statistics are then calculated into Performance charts that are updated continuously.
In the main Campaign list, you can see a summary including your original Budget, Amount delivered, Quantity, Impressions, Clicks, and CTR (click-through-rate).

The daily statistics are calculated into Performance charts which are updated continuously.
Statistics are collected from Creative level all the way up to totals for all your Campaigns.
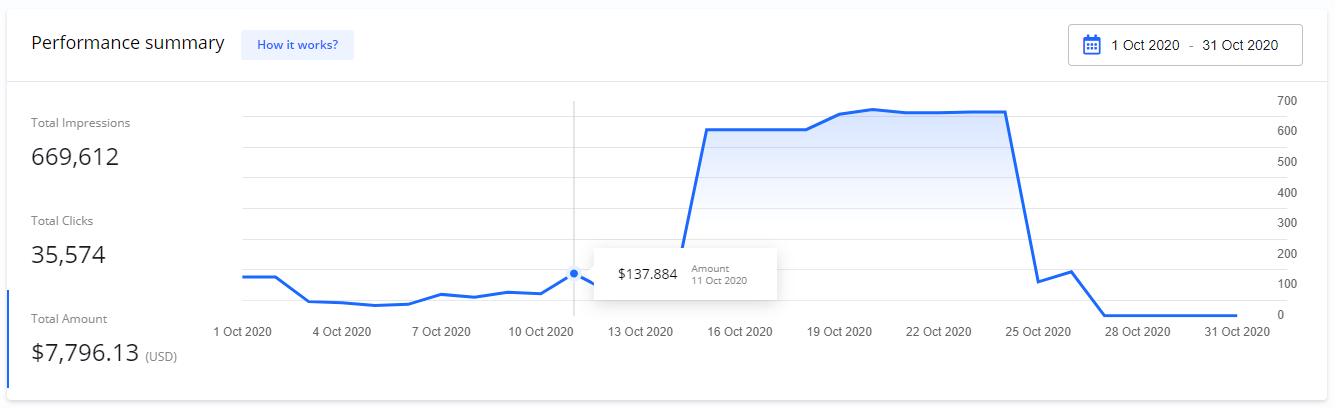
Performance summary
On your Dashboard > Performance summary, you get an overview of the total statistics for all your Campaigns.
Total Impressions
This is the total number of times your ads have been shown.
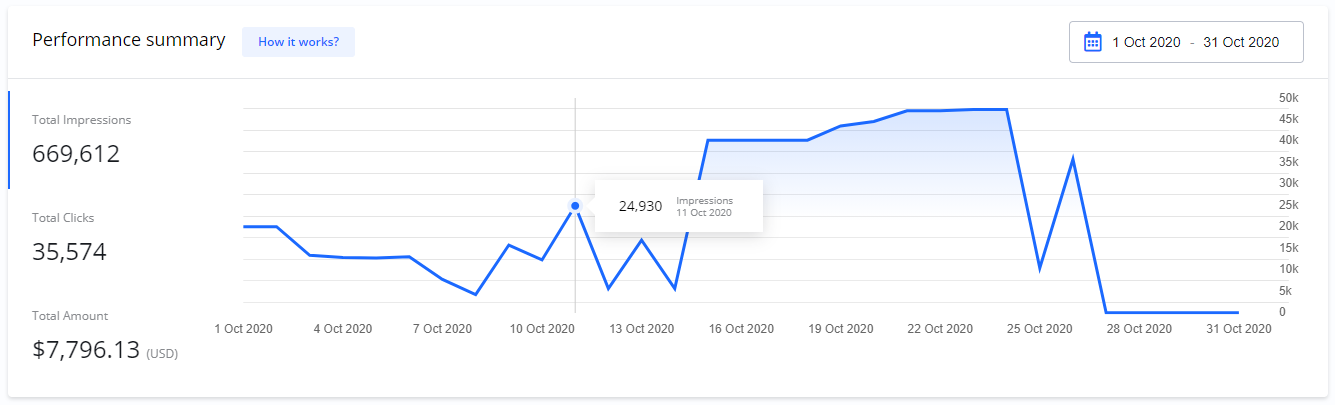
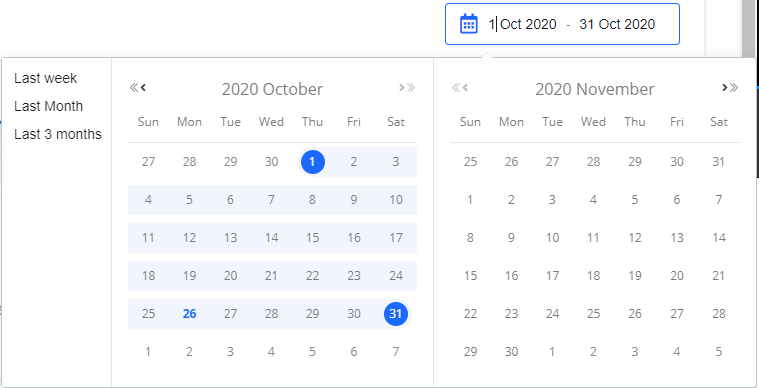
The chart for this metric can be filtered by Start and End dates.
If you move your mouse over the chart, you can see more details for specific data points.
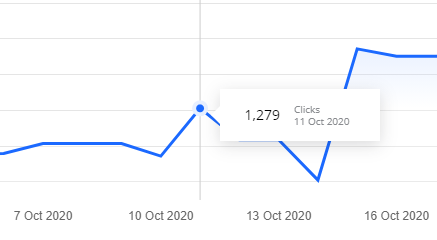
Total Clicks
This is the total number of times people have clicked your ads.
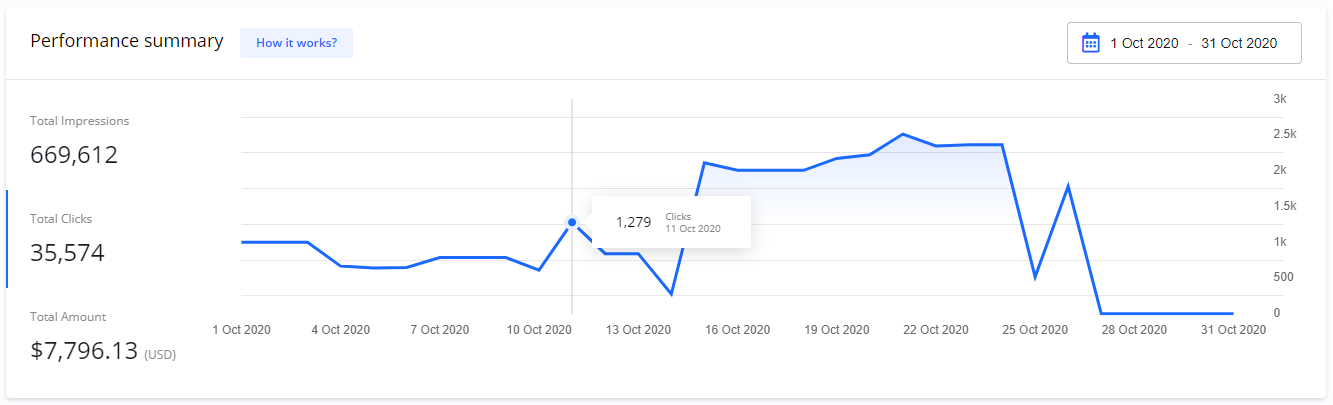
Total Amount
This is the total amount delivered across all your Campaigns.
Campaign performance
On the Campaign details > Performance tab, you can find detailed statistics for an individual Campaign.
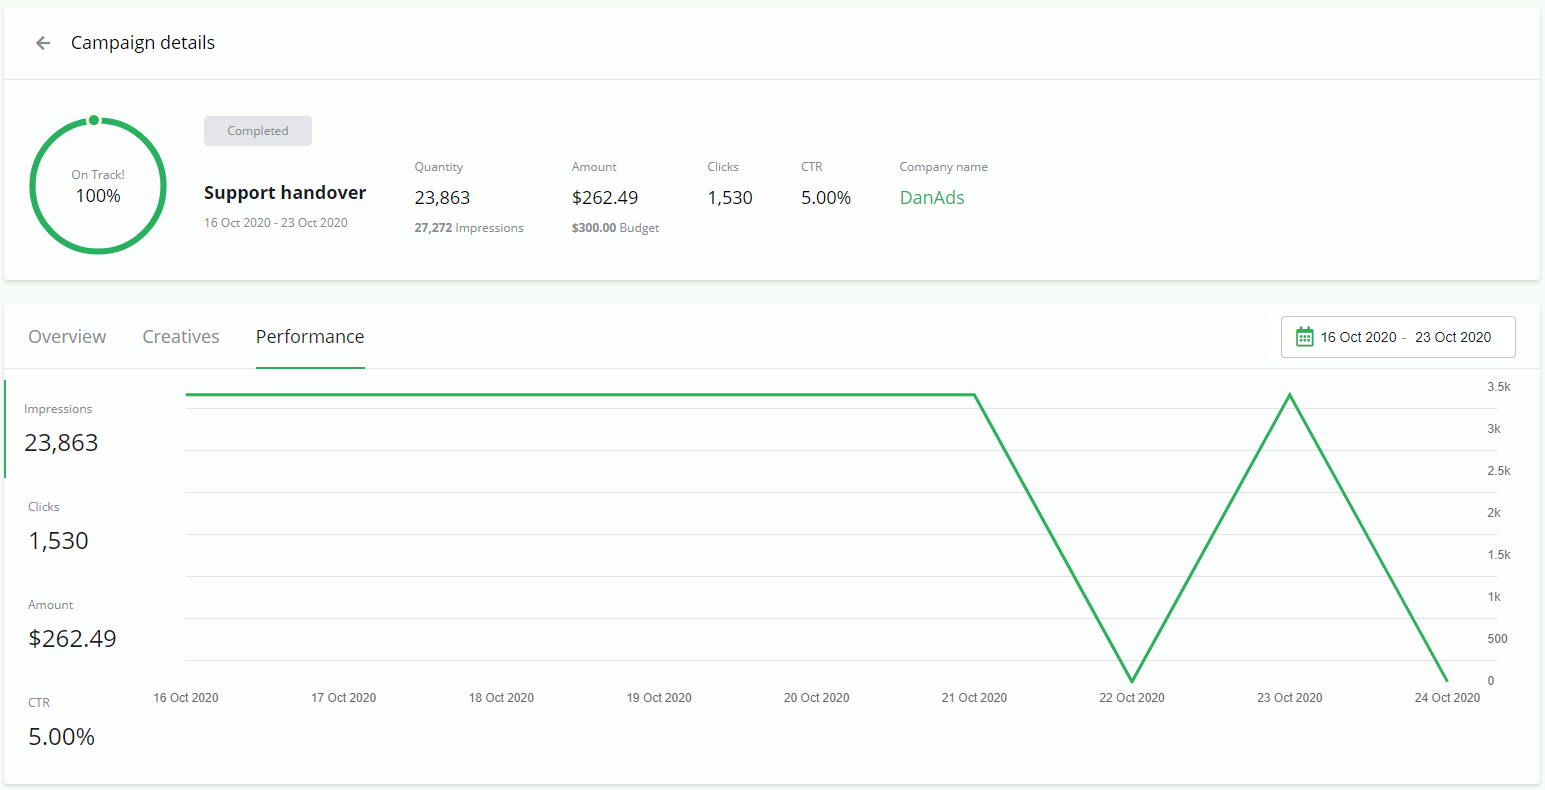
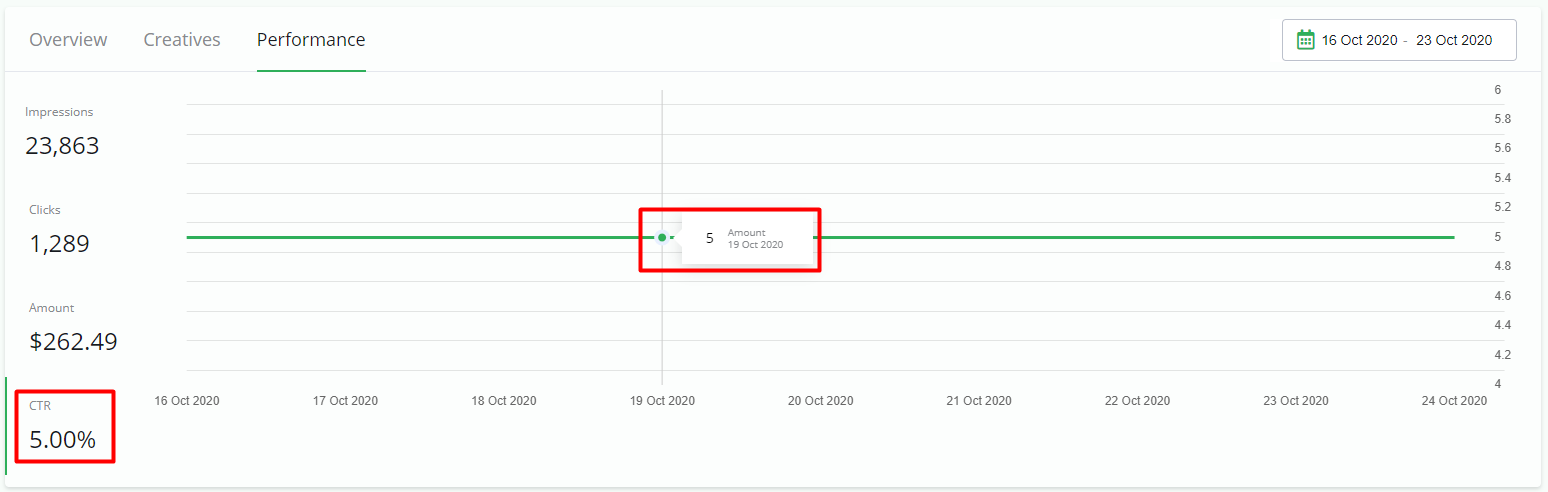
CTR - Click-Through-Rate
In addition to Impressions, Clicks, and Amount, this view also shows your CTR (Click-Through-Rate). CTR is the percentage of people who saw your ad and clicked on it. It is calculated as:
CTR = Clicks / Impressions
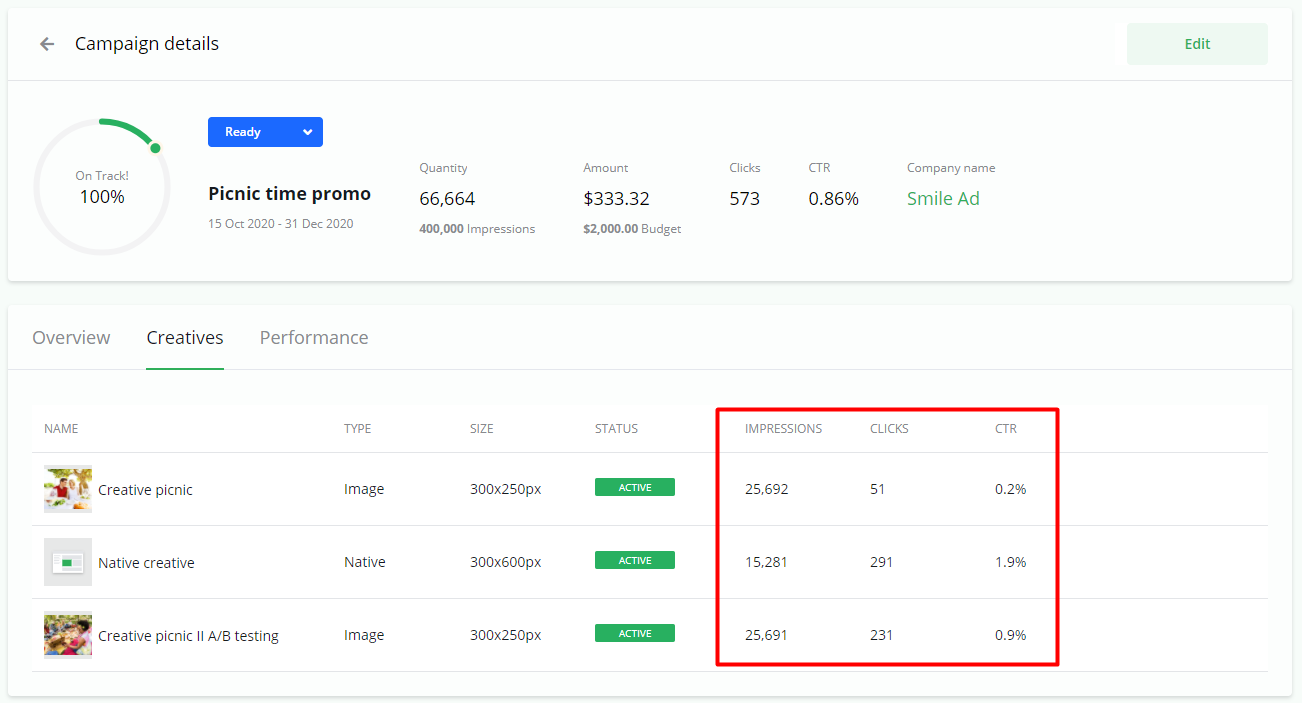
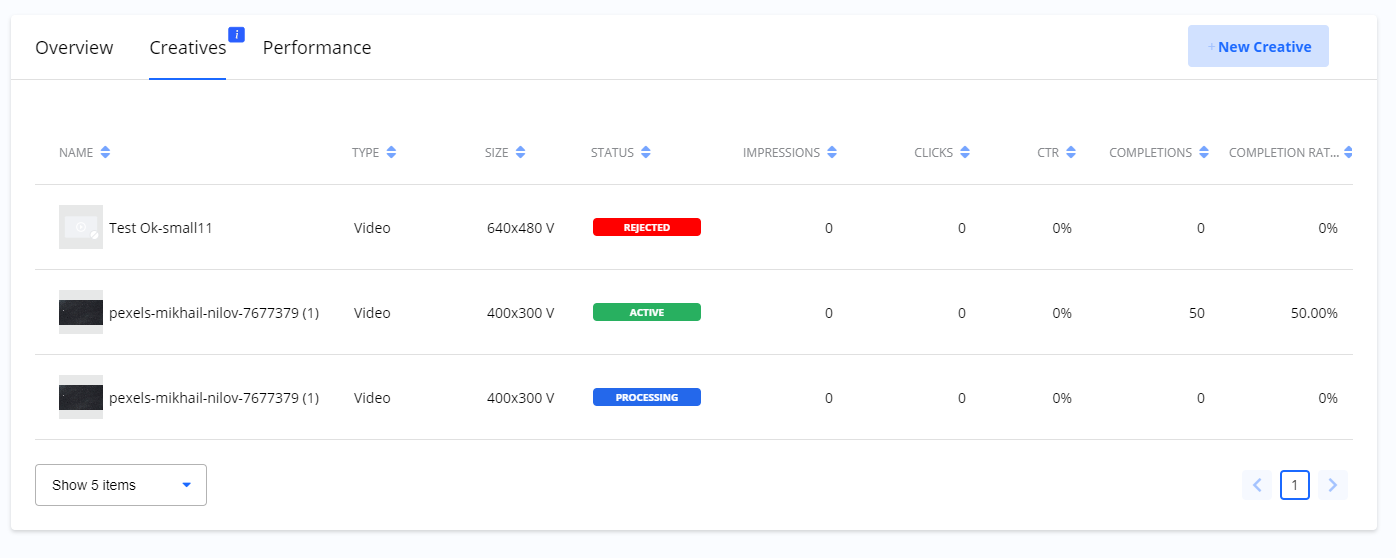
Creatives statistics
On the Campaign details > Creatives tab, you can find an overview of statistics for each individual Creative. You can use this information to compare performance and see which of your ads performs best.
Statistics for video Creatives
For video Creatives, the statistics include the standard metrics (Impressions, Clicks, and CTR) plus two additional ones:
-
Completions: The number of times the video was played to the end.
-
Completion Rate: The percentage of video plays that resulted in a completion.
Frequently Asked Questions
Q: How often are the statistics updated?
A: Performance statistics are collected and updated daily.
Q: What is CTR?
A: CTR stands for Click-Through-Rate. It is the percentage of views that resulted in a click, calculated by dividing the total number of Clicks by the total number of Impressions.
Q: Where can I see the performance of all my Campaigns combined?
A: A total performance summary for all your Campaigns is available on your main Dashboard under the Performance summary section.
Q: Where can I see how one specific ad is performing?
A: You can find statistics for an individual Creative by navigating to the Campaign details page and selecting the Creatives tab.